
Break-Even Explained: Meaning, Formula, Importance and How Break-Even Helps Businesses
The break-even point is a crucial concept in business and finance that helps determine when a company will start making profits. It represents the stage at which total revenue equals total costs, meaning there is no profit or loss.
Understanding the break-even point is essential for business owners, managers, and investors as it provides clarity on cost structures, pricing strategies, and financial planning. It serves as a foundation for making informed business decisions.
Whether you are starting a new business or managing an existing one, break-even analysis helps in setting realistic financial goals and ensuring sustainability.
What Is Break-Even Point?
The break-even point is the level of sales at which total revenue equals total costs. At this point, the business neither makes a profit nor incurs a loss.
- No profit, no loss situation
- Total revenue = Total costs
- Indicates minimum sales target
- Essential for financial planning
It marks the starting point for profitability.

Break-Even Formula
The break-even point can be calculated using a simple formula:
- Break-Even Point (Units) = Fixed Costs ÷ (Selling Price per Unit − Variable Cost per Unit)
This formula helps businesses determine the number of units they need to sell to cover all costs.
Key Components of Break-Even Analysis
Break-even analysis involves three main components:
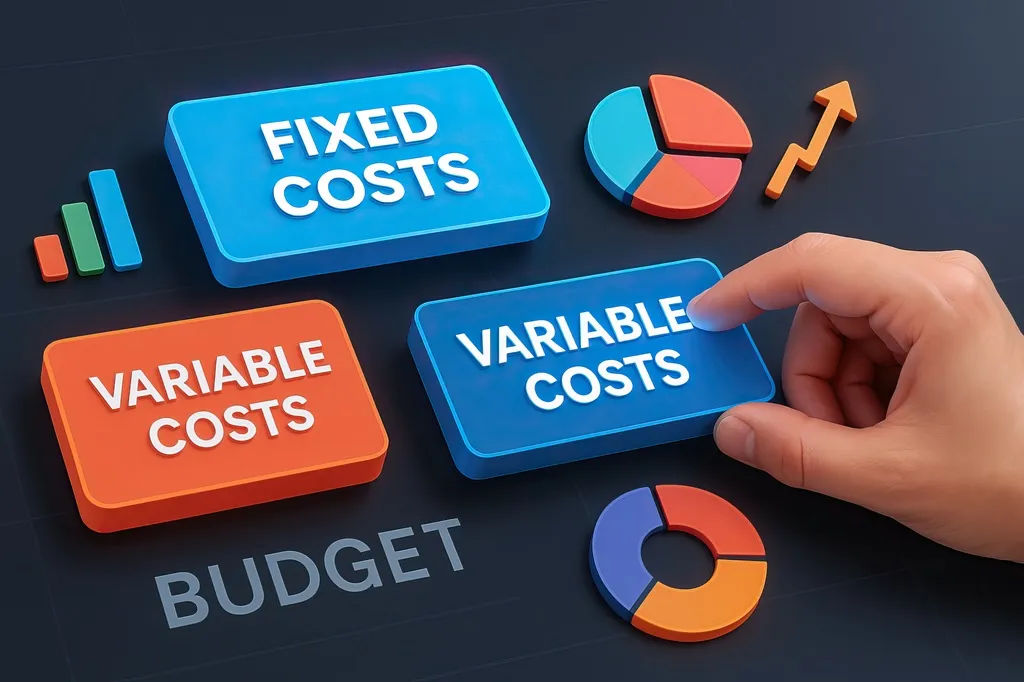
- Fixed Costs: Costs that do not change (rent, salaries)
- Variable Costs: Costs that vary with production (materials)
- Selling Price: Price per unit of product
These components determine the break-even point.
Importance of Break-Even Analysis
Break-even analysis is essential for understanding financial performance and planning.
- Helps set sales targets
- Supports pricing decisions
- Assists in cost control
- Reduces financial risk
It provides a clear roadmap for achieving profitability.
How Break-Even Helps Businesses
Break-even analysis helps businesses make informed decisions and improve efficiency.
- Determines minimum sales required
- Evaluates business viability
- Guides pricing strategies
- Supports financial planning
It is a powerful tool for business success.
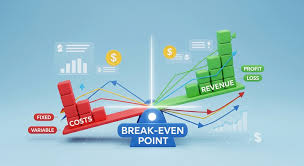
Break-Even Chart Explained
A break-even chart visually represents the relationship between costs, revenue, and profit.
- X-axis → Units sold
- Y-axis → Costs and revenue
- Intersection point → Break-even point
This chart helps in better understanding financial performance.
Advantages of Break-Even Analysis
- Simple and easy to understand
- Helps in decision-making
- Identifies cost structure
- Supports financial planning
These advantages make it widely used in business.
Limitations of Break-Even Analysis
- Assumes constant costs
- Ignores market demand changes
- Not suitable for complex businesses
Understanding limitations ensures better application.
Real-Life Examples
Break-even analysis is used in various industries to determine profitability.
- Retail businesses
- Manufacturing companies
- Startups
- Service providers
It helps in planning and growth strategies.
Break-even analysis is the foundation of profitability—it shows when effort turns into earnings.
Role in Financial Planning
Break-even analysis plays a vital role in financial planning by helping businesses set realistic goals and manage resources effectively.
- Supports budgeting
- Improves cost management
- Enhances profitability planning
It is essential for sustainable growth.
Frequently Asked Questions
What is break-even point?
It is the point where total revenue equals total costs.
Why is it important?
It helps determine when a business becomes profitable.
What is the formula?
Fixed Costs ÷ (Selling Price − Variable Cost).
Conclusion
Break-even analysis is a powerful financial tool that helps businesses understand their cost structure, set sales targets, and achieve profitability. By mastering this concept, businesses can make informed decisions, reduce risks, and ensure long-term success.